Berkeley SPICE is a software package to simulate the operation of electronic devices, and one version of it is available at no charge from WinSpice. This version is designed for Windows but can be made to run on Linux using WINE. Spice Opus is another, similar program also available for both operating systems. Below WinSpice is being used to simulate the operation of a Colpitts oscillator. At the left is a schematic diagram of the circuit with the nodes numbered, and at the right is the output obtained from the program. The simulation file itself is plain text which conforms to certain rules of syntax, and can be composed with any text editor.
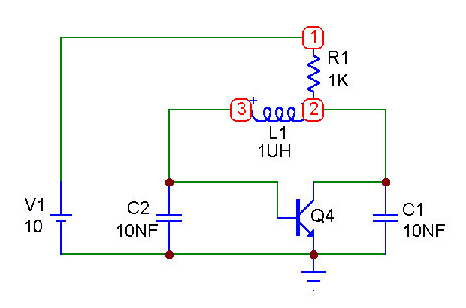

Colpitts oscillator
v1 1 0 dc 10v
r1 1 2 1k
l1 2 3 1uh
c1 2 0 10nf
c2 3 0 10nf
q4 2 3 0 qnl
.model qnl npn
.end
The nodes are numbered as in the schematic at the left. Node numbers are arbitrary, except that the ground is always designated as "0". SPICE statements are not case-sensitive. Voltage sources always begin with "v," resistors with "r," capacitors with "c," and BJT's with "q." The latter, as a non-linear device, needs a model specification; in this case, all the defaults are selected. The node numbers for a triode transistor correspond, in the following order, to: collector, base, emitter.
After the program starts, the first step is to tell it where to find your file: